Hello again, Today We are going to continue our series by checking Chapter 2 in system Design Interview Book.
Back of the envelope estimation
Sometimes you are asked to estimate system capacity or performance requirements using back-of-the-envelope estimation.
Back of the envelope estimation are estimates we create using a combination of thought experiments and common performance numbers
We need to have a good sense in scalability basics to effectively carry out back-to-the-envelope estimation
The Following Concepts should be well understood:
Power of two
Latency Numbers
Availability Numbers
Power of Two
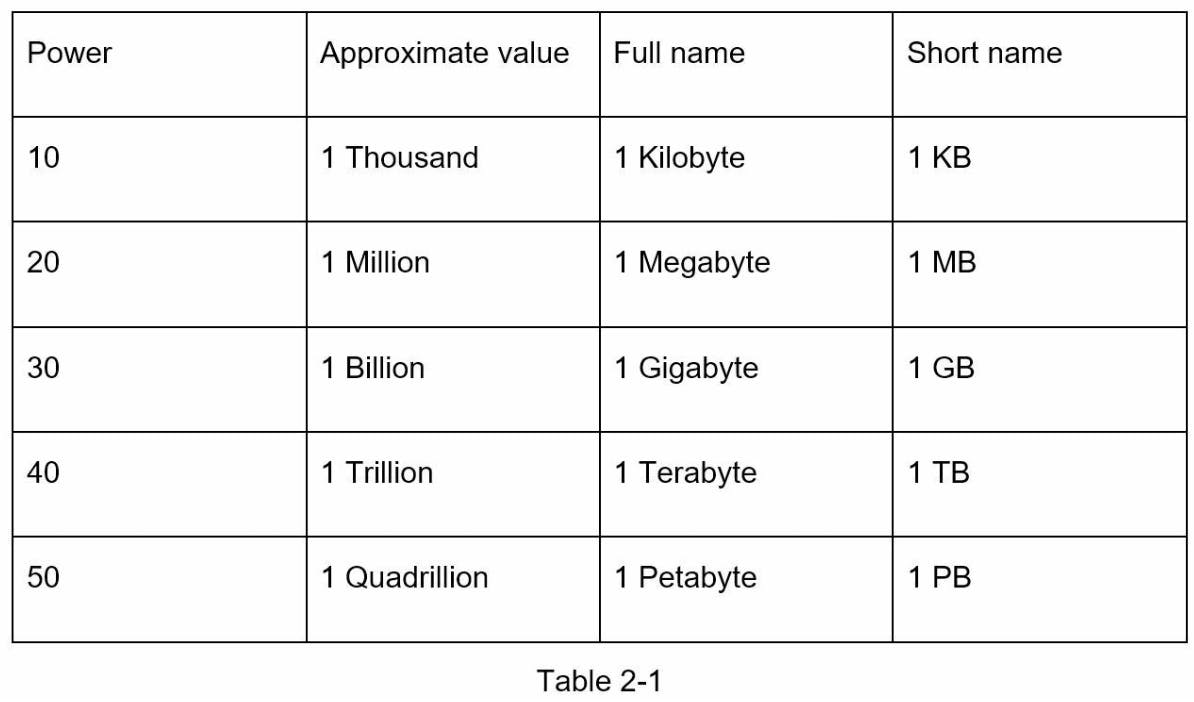
To obtain correct calculations, it is critical to know the data volume unit using the power of 2
A byte is a sequence of 8 bits. ASCII Character holds 1 byte in memory(8 bits)
The Following Table Explains the data volume units

Latency Numbers
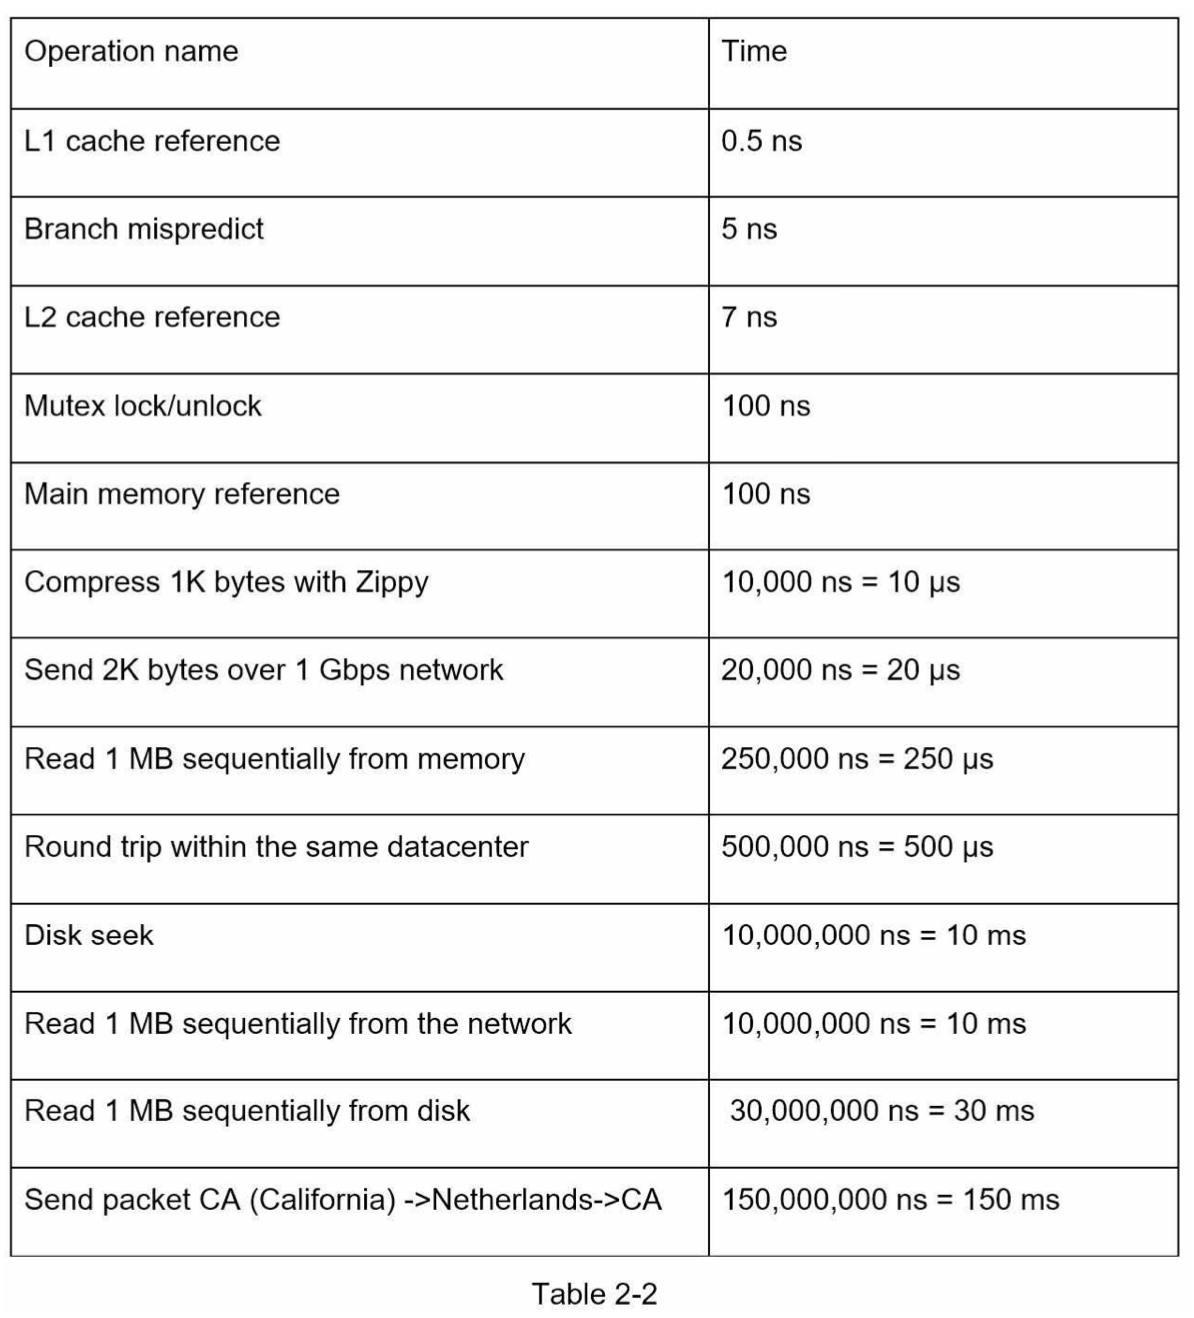
Dr.Dean From Google reveals the length of typical computer operations in 2010 "This list could be outdated because computers became faster and more powerful"

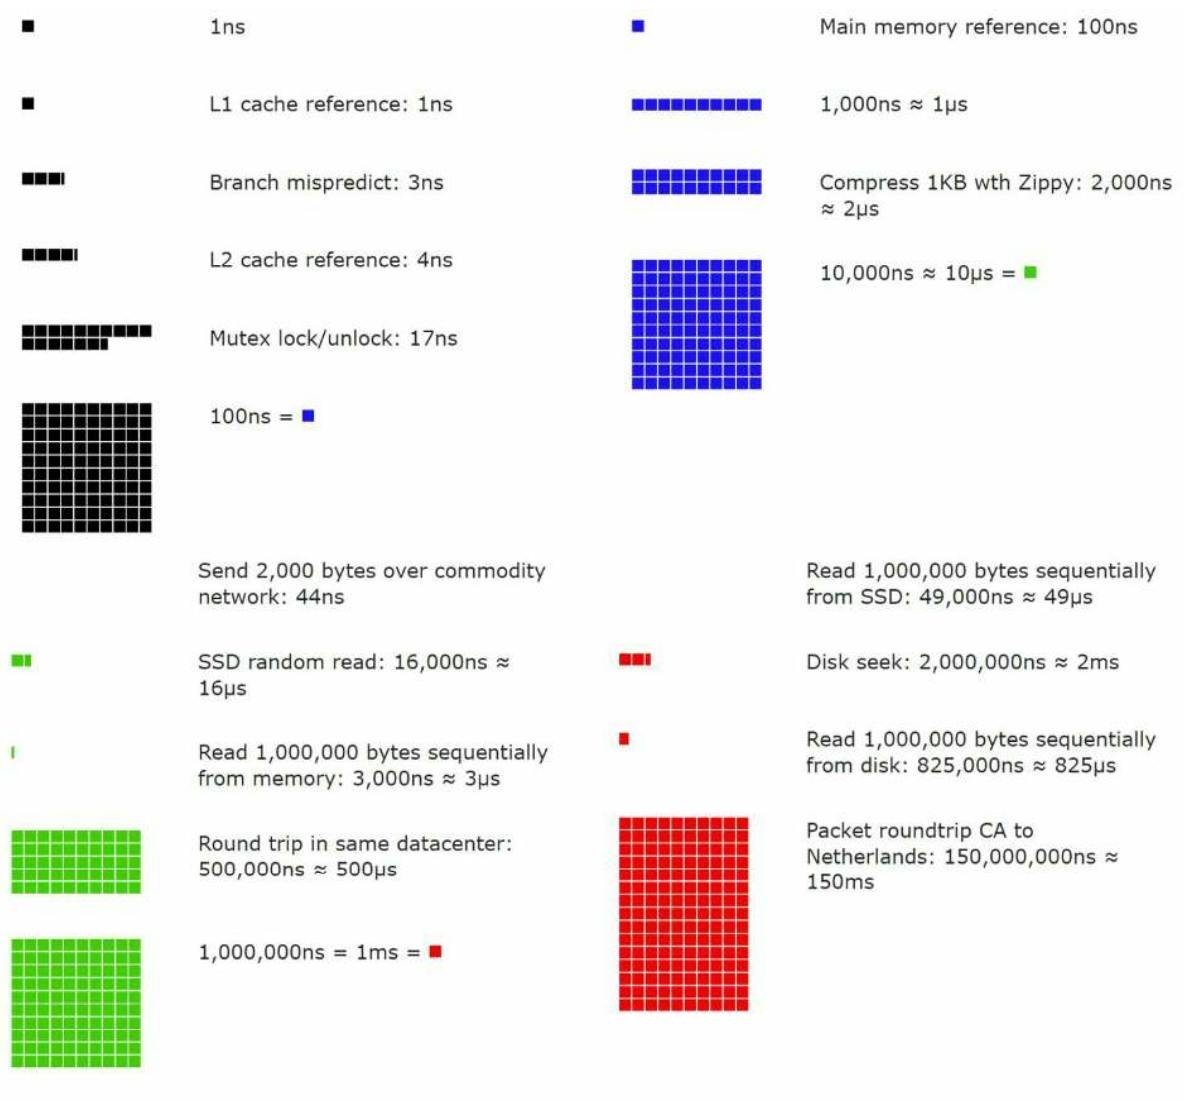
A google Software engineer built a tool to visualize Dr.Dean's numbers. the tool also takes time factor into consideration.

Analysis of latency numbers
Memory is fast but the disk is slow
Avoid disk seeks if possible
Simple compression algorithms are fast
Compress data before sending it over internet if possible
Data centers are usually in different regions and it takes time to send data between them
Availability Numbers
High availability is the ability of system to be continuously operational for a desirably long period of time.
High availability is measured with percentage, for example if we say a service with 100% availability means that service has 0 Downtime.
What is SLA
SLA(service level agreement) is a commenly used term between service providers and client, which defines the level of uptime your service will deliver.
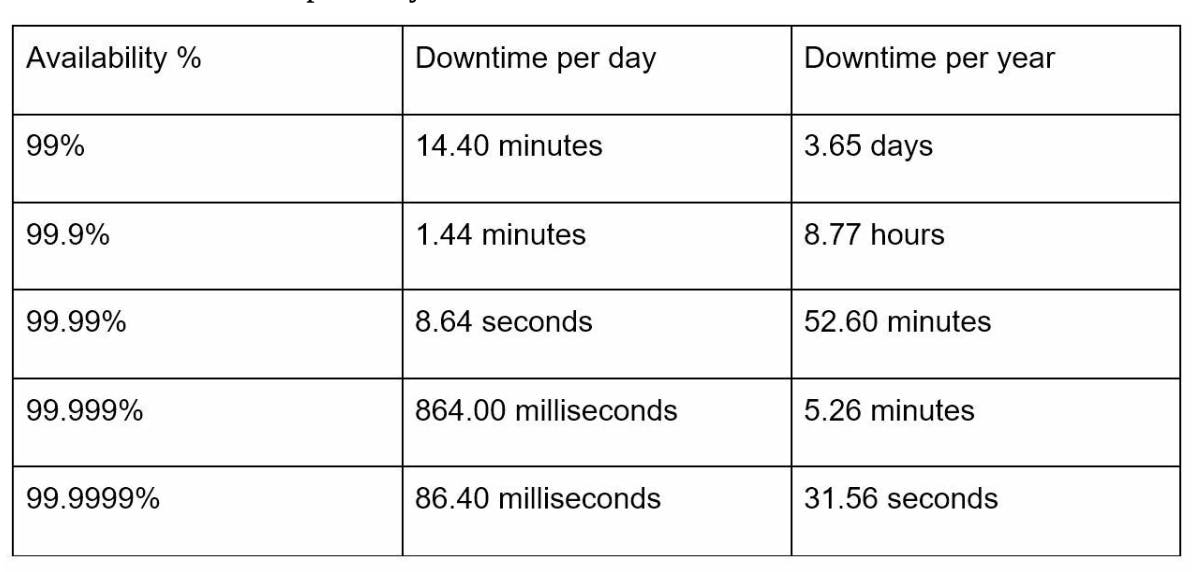
Uptime is traditionally measured in nines, the more nines the better. you can check the next table for more illustration

Twitter Example
Lets say for example Estimate Twitter QPS(Query per second) and storage requirements kindly note the following numbers are for excerise and not the precise numbers from twitter
Assumptions
300 Million monthly active users.
50% of users use twitter daily
User posts 2 tweets per day
10% of tweets contains media
Data stored for 5 years
Estimations
QPS estimations
Daily active users (DAU): 300 * 50% = 150 million
Tweets QPS = 150 million * 2 tweets / 24 hours/ 3600 seconds = ~3500
Peek QPS = 3500 * 2 = ~7000
Media Estimation
Average Tweet size:
Tweet_id : 64 bytes

Text: 140 bytes

Media: 1 MB
Media storage = 150 x 2 x 10% x 1 MB = 30TB per day
5-year Media storage = 30 x 365 x 5 = ~ 55PB
